W.D. Gann MATHEMATICAL FORMULA FOR MARKET PREDICTIONS THE MASTER MATHEMATICAL PRICE TIME AND TREND CALCULATION This chart is made on transparent plastic so that you can place it over daily, weekly, or monthly high or low chart and see at a glance the position on the time and place based on the geometrical angles. It is designed to give QUICK ACCURATE EASY CALCULATIONS: SAVE TIME AND PREVENT ERRORS. The square of 12 is always important in working out time periods because there are 12 month in a year. The square of 144 is the GREAT SQUARE and works better than any others square both for TIME AND PRICE because it contains all of the squares from 1 to 144. This chart is divided up into sections of 9 both for time and price because 9 is the highest digit. Nine spaces on the daily chart equals 9 days, 9 weeks or 9 month in time periods and 9 equals 9c on grains, 9 ...
The Time Factor OF W. D. Gann W.D. Gann’s outstanding skill was his ability to produce accurate annual forecasts of the stock and commodity markets. Gann stated that his forecasts were based on his secret “time factor”. However, careful analysis of his novel entitled “The Tunnel Thru The Air” reveals Gann’s belief in the overwhelming importance of astrology. Therefore astrology is the real basis of Gann’s annual forecasts. Indeed, astrological analysis is implicit at key points in his books and courses. Consequently it is concluded that if we wish to emulate Gann’s outstanding forecasting skills we must follow in his footsteps by firstly learning astrology and then apply ...
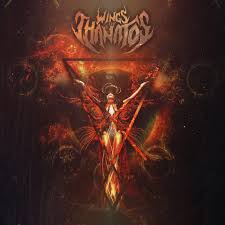
Thanatos, God of Death I wrote the other day about how there’s an epidemic of bad vibes sweeping across the globe. Everyone I know feels strangely shaky, anxious, disoriented lately — no, it’ s not just you. What’s behind all this? It’s obvious to say that living through an age of collapse like we are — countries fracturing, planet dying, economies melting down, of Brexits and Trumps — is profoundly distressing. It keeps us up at night. Is this really who we’ve become? As a result, a greater tilt in the world’s axis — the tenor and tone of the world’s emotions is changing. This is an age of death. Democracy, the planet, decency, humanity, society, global order, the future — just a few things that are dying. You see that impulse you just had to justify and rationalize this away (with factoids, stats, numbers, some vague notion that “life will go on!” — instead of feeling something, like grief, mourning, or sorrow? I’ll come back to that. What’s happening t...

Comments
Post a Comment